Steel drum leakage detection signal processing based on time-frequency domain (4)
Signal Processing for Steel Drum Leak Detection Based on Time-Frequency Domain (4)
Van Persie
Chapter IV: Design of the Acoustic Emission Detection System for Steel Drum Leaks
With the growing adoption of object-oriented programming and continuous advancements in technology, the development and use of graphical user interfaces (GUIs) have become increasingly widespread. GUIs offer a more intuitive and efficient working environment, saving time and simplifying system design. In this project, we used MATLAB's GUI platform to build the leak detection system, implementing an object-oriented interface to manage the functions required for acoustic emission signal analysis [1].
4.1 System Design
4.1.1 GUI Design Steps:
1. Determine the key functions the system needs to perform and identify which modules will be used.
2. Sketch the GUI layout, adjust the positions and sizes of each component, and finalize the design.
3. Add necessary menus, buttons, and controls based on the final GUI plan.
4. Implement the function code for each module, along with corresponding button and menu callback functions, and test each part to ensure it works as intended.
4.1.2 Module Selection:
The system is designed to handle specific tasks, and different modules are selected accordingly. Figure 4.1 shows the final GUI layout. It includes the input data button, execution button, coordinate axis for waveform display, static text box for results, and a clear data button.
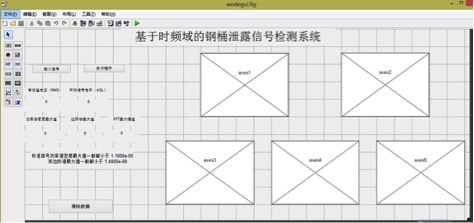
Figure 4.1 Final GUI Interface Plan
4.2 System Implementation
Each button and module has a callback function that enables the system to process and analyze acoustic emission signals from steel drums.
(1) Input Data Button
This button uses the uigetfile() function in MATLAB to open a file dialog, allowing users to select a text file containing the data. The input data is stored as a global variable. The main code is shown below:
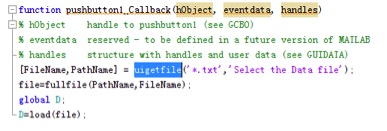
Figure 4.2 Code for Input Data Button
After running, the file selection dialog shown in Figure 4.3 appears.
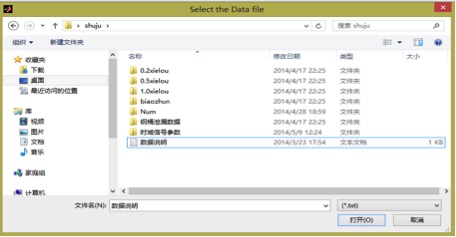
Figure 4.3 File Selection Dialog
(2) Execution Program Button
This button triggers the analysis of the input data using MATLAB’s time-frequency tools, including FFT, power spectrum estimation, Hilbert transform, marginal spectrum, and RMS calculation. Some of the relevant functions are shown below:
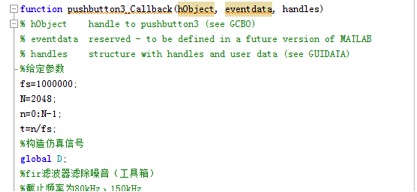
Figure 4.4 Code for Execution Button
(3) Axis Module and Static Text Box Module
The axes() function is used to plot the waveform generated by the execution module. The code is shown below:
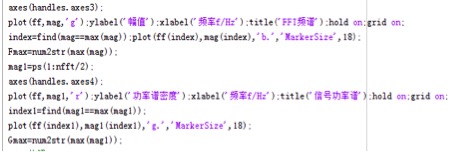
Figure 4.5 Code for Axis Module
The static text box displays the calculated results. Its code is as follows:
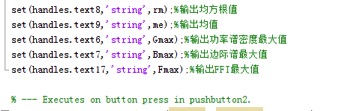
Figure 4.6 Code for Outputting Results
(4) Clear Data Button
This button clears the displayed data and resets the system using the set() and cla() functions. The code is as follows:
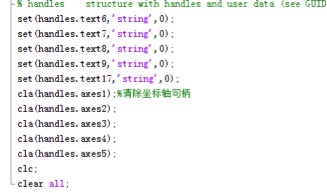
Figure 4.7 Code for Clear Button
After editing all the callback functions, the GUI is saved and run. When testing with a 0.5mm leaking steel drum signal, the result shown in Figure 4.8 was obtained, confirming that the system successfully detects acoustic emission signals.
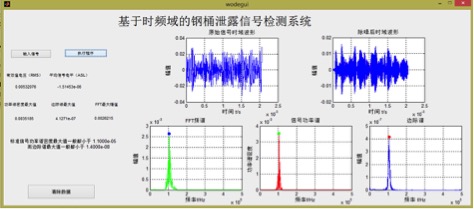
Figure 4.8 Acoustic Emission Parameters of 0.5mm Leaking Steel Drum
4.3 Summary of This Chapter
The overlay plots of acoustic emission signals from different steel drums are shown in Figure 4.9. The frequency spectrum, power spectrum, and marginal spectrum clearly show the characteristics of the signals. As the leakage size increases, the maximum amplitude of the power spectrum and marginal spectrum also increases. The RMS values follow the same trend. From multiple tests, the maximum power spectral density and marginal spectrum amplitudes of standard steel drums were found to be less than 1.1×10â»âµ and 1.4×10â»â¸, respectively.
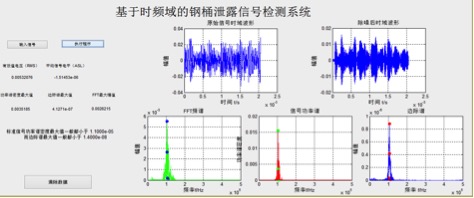
Figure 4.9 Overlay of Acoustic Emission Signals
[20] Li Lei. Design of digital image processing system based on MATLAB GUI [D]. Master’s thesis of Chengdu University of Technology, 2012.
[21] Wu Xinyu, Zhou Jingquan, etc. Signal and System - Time Domain Frequency Domain Analysis [M]. Beijing: Publishing House of Electronics Industry, 2000.
[22] Zhang Defeng. MATLAB digital signal processing and application [M]. Beijing: Tsinghua University Press, 2010.
[23] Ge philosophy, Chen Zhongsheng. MATLAB time-frequency analysis technology and its application [M]. People's Posts and Telecommunications Press, 2006
Thanks
ã€Related Links】
Steel Drum Leak Detection Signal Processing Based on Time-Frequency Domain (1)
Steel Drum Leak Detection Signal Processing Based on Time-Frequency Domain (2)
Steel Drum Leak Detection Signal Processing Based on Time-Frequency Domain (3)
Steel Drum Leak Detection Signal Processing Based on Time-Frequency Domain (4)
Steel Drum Leak Detection Signal Processing Based on Time-Frequency Domain (5)
Ji'An ZhongXiang Natural Plants Co.,Ltd. , https://www.zxessentialoil.com